Free
Trial workspace€0Free
Test one focused setup.
New users deciding whether CandleDraw fits the way they think and communicate.
A trial with no time limit: enough to draw one pattern end to end and find out whether the tool thinks the way you do.
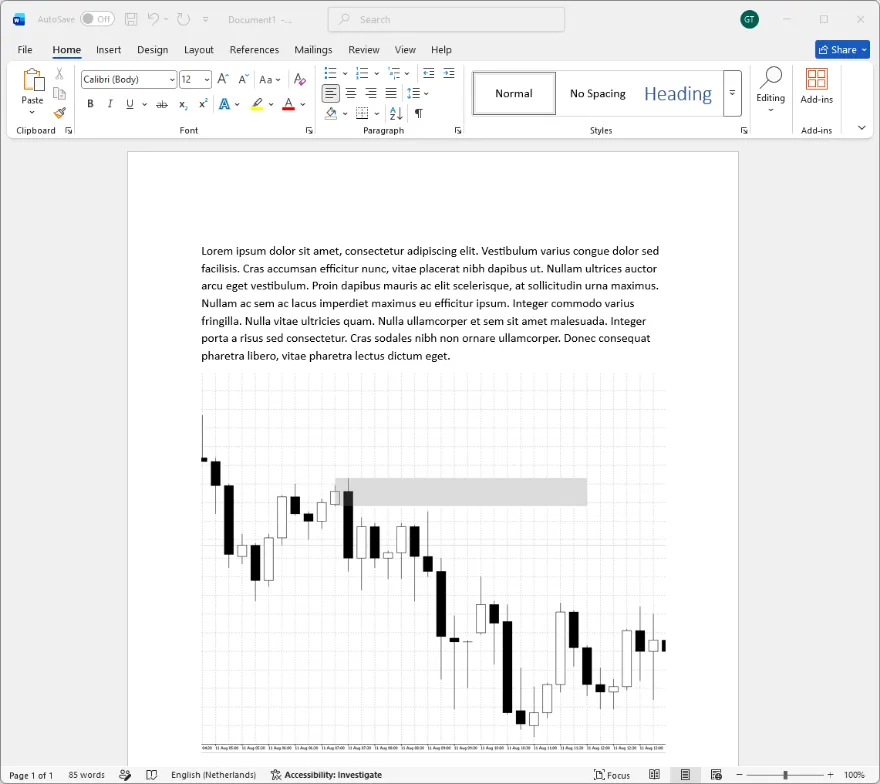
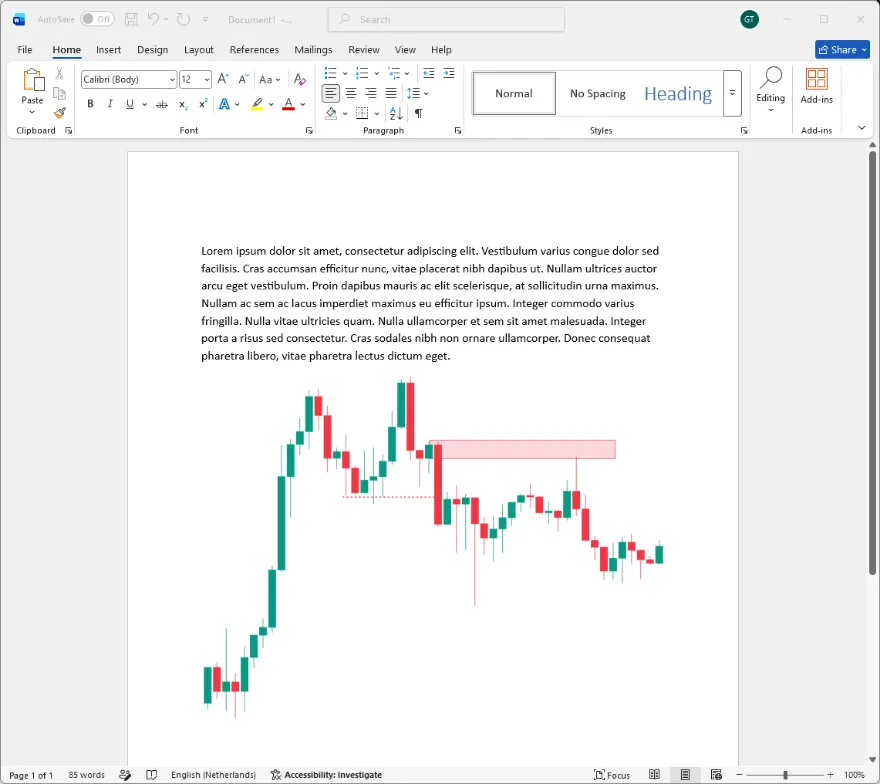
The chart you need to show usually doesn’t exist yet: the textbook example, the setup still forming, the version where it failed. Draw it, set every open, high, low and close exactly, attach the reasoning, and take away a clean image.
Already have an account?
Not a terminal. No live data, no signals, no execution. CandleDraw is where you build the chart you are going to explain: from scratch, from a generator, or from your own imported CSV of forex, stock or crypto prices.
Your playbook and your journal are probably screenshots from a terminal: different scales, different chrome, none quite showing what you meant. Draw the setup you take, import the session it happened in, or generate the case to compare it against. One canvas, one size, precise enough to recognise the next one.
Journal your candlesTo teach is to learn twice
Build the curriculum, group students into a cohort, draw the example that makes the concept obvious, set it as homework, and mark what comes back, in the drawing space they learned in rather than a second tool.
Students need no paid plan to join a cohort or hand work in.
The teaching loopYou join on an invite from an educator and work through the curriculum on the canvas they set it on. Hand each assignment in when it is done, and open the graded one to read the feedback where the marks are.
A free account is all you need.
How assignments workThe workflow
The shortest path through CandleDraw is also the main one, and the first move is a choice rather than a step: four ways in, all landing on the same editable candles.
Every route arrives at the same editable candles.
any one of these
Say what the chart is for, on the chart.
as many as the argument needs
The picture leaves; the work stays.
either, or both
…or assign it. Educators send the same canvas out as homework instead of exporting it, and mark what comes back on the chart they set.
Where the image lands. A trading journal, the homework in a course, a newsletter figure, the chart a YouTube breakdown is narrated over, the slide behind you, or the marketing for your own teaching: the thumbnail, the post, the page that sells the course.
Your charts are not in a beauty contest. But a cleaner figure is a clearer one: the terminal chrome and the gridline noise cut away, the overview kept. The difference shows the day you read the entry back.
The same clarity belongs in the strategy document and the trading system as much as the journal. And the day’s chart is not recreated by hand: import the actual data for the pair you traded, and mark it up on the prices that printed.
Explore the core workflow with Free, build serious trading setups with Pro, or run a structured teaching program with Educator.
€0Free
Test one focused setup.
New users deciding whether CandleDraw fits the way they think and communicate.
A trial with no time limit: enough to draw one pattern end to end and find out whether the tool thinks the way you do.
€7per month
Build your trading playbook.
Active traders and analysts who document strategies and mark up repeatable setups.
Everything in Free, plus the whole instrument: every drawing tool, every study, replay, multi-timeframe, and your own branding on the way out.
Create your account first, then choose this plan.
€50per month
Teach, assign, and grow.
Trading educators running a teaching business: cohorts, coursework, and structured student feedback.
Everything in Pro, plus the working parts of that business: cohorts, canvas homework, review, the highest limits, and an affiliate link that earns a commission on the paid accounts it brings in.
The Educator plan is in beta and not on sale yet. Cohorts and assignments are still being finished.